
Composition of Soils
Storyboard 
The main components of soil include both coarse and fine sand, silt, and clay. The proportion of these three components varies depending on the type of soil. Due to significant differences in particle size among these components, spaces known as pores are formed. These pores can accommodate or facilitate the flow of water, which in turn affects the moisture content of the unsaturated part of the soil.
ID:(363, 0)
Soil model
Image
Soils have a basic structure composed of different layers that result from their initial formation and how they develop, influenced by factors such as erosion and vegetation growth. While the thickness of these layers can vary significantly, they exhibit clear patterns in terms of their organic matter content:
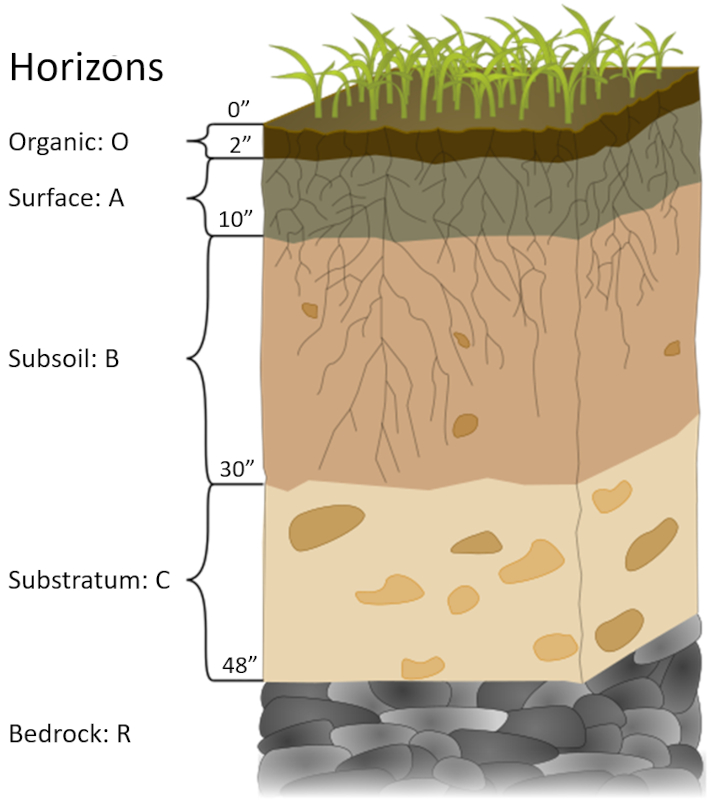
Soil profile (commons.wikimedia.org - translated)
O: Organic Surface Layer
This layer originates from the accumulation of organic matter, primarily consisting of decomposing plant material and humus. The amount of organic material can reach up to 100%, depending on the type of vegetation and its stage of development.
A: Surface Soil
The A horizon is formed through a combination of mineral erosion, the addition of organic matter from the upper horizon, and the activities of soil organisms. Most of this layer is composed of soil's inherent mineral components, with an organic matter content that can reach up to 10%.
B: Subsoil
The B horizon accumulates minerals and leached materials that have moved downward from the A horizon. This accumulation may also result from the arrival of minerals transported from other areas and chemical processes occurring within the horizon. In this layer, the majority of components are soil minerals, with an organic matter content that can reach up to 5%.
C: Substratum
The C horizon is primarily formed by geological processes and contributes to the overall terrain configuration. It provides materials that interact with the upper layers. In this layer, most components consist of soil minerals, with an organic matter content that can reach up to 1%.
The thickness of the first two layers can vary from a few centimeters to several tens of centimeters, while the latter layers can span from tens of centimeters to meters. It is important to note that the thickness values mentioned in the Wikipedia image are provided solely as illustrative examples and may vary widely in reality.
ID:(15066, 0)
Using sieves to separate components
Note
Soil is composed of varying proportions of sand, silt, and clay. Therefore, to model soil behavior accurately, it is necessary to represent its structure as a mixture of these components.
The simplest way to determine the composition of a particular sample is by calculating the mass of each component in relation to the total mass. To do this, physically separating each sample into its individual components is required, taking advantage of the differences in particle size. After drying and grinding the soil, a sieving process is performed using multiple sieves of different sizes, chosen based on the required precision:
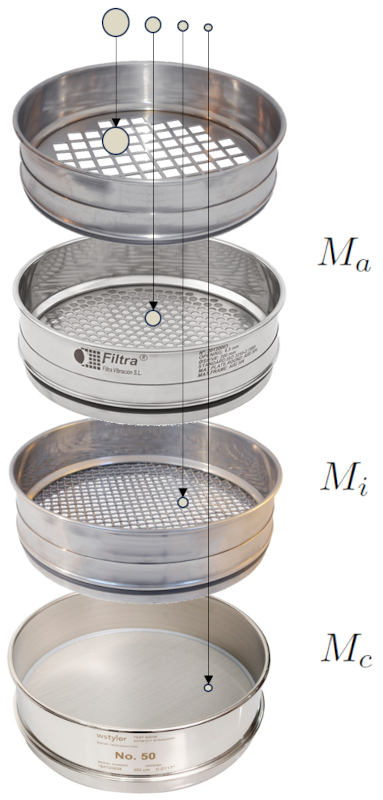
The image illustrates a scheme that separates three components, which could correspond to measurements of sand, silt, and clay. However, it is possible to use multiple sieves to differentiate, for example, coarse sand, medium sand, and fine sand, as needed.
The main masses are as follows:
• the dry mass of sand in the sample ($M_a$): Mass of all sand grains.
• the dry mass of silt in the sample ($M_i$): Mass of all silt grains.
• the dry mass of clay in the sample ($M_c$): Mass of all clay grains.
ID:(2067, 0)
Distribution of sand, silt and clay
Quote
A ternary diagram is a visual tool used to represent the relative proportions of three components, such as silt, sand, and clay. In this diagram, each corner is dedicated to one of these components, and various points within the triangular space signify unique combinations of these constituents.
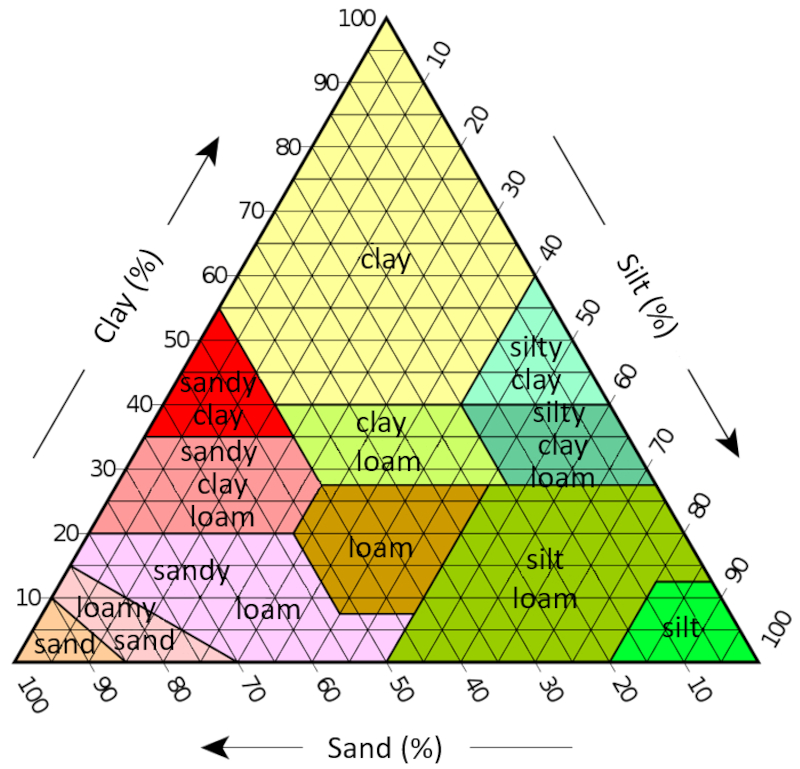
To interpret a ternary diagram for silt, sand, and clay:
1. Identify the components' locations:
- Sand typically occupies the bottom-left corner.
- Silt is found at the bottom-right corner.
- Clay is situated at the top corner.
2. Analyze the mixtures:
- Points located inside the triangle denote diverse mixtures of these three components.
3. Understand lines and zones:
- Lines traversing the triangle signify consistent ratios of the three components.
- Different regions within the triangle correspond to distinct soil classifications.
In particular, for the specified zones, the following ranges can be estimated:
| Type | $g_a$ | $g_i$ | $g_c$ |
| Clay | 0-45 | 0-40 | 55-100 |
| Loam | 23-53 | 28-50 | 40-60 |
| Sand | 85-100 | 0-15 | 0-10 |
| Silt | 0-20 | 87-100 | 0-12 |
| Silty clay | 70-90 | 0-35 | 0-15 |
| Sandy clay | 45-80 | 0-28 | 20-35 |
| Clay loam | 45-65 | 0-20 | 35-55 |
| Silty clay loam | 0-50 | 50-87 | 0-27 |
| Sandy clay loam | 0-20 | 40-72 | 28-40 |
| Silt loam | 0-20 | 40-60 | 40-60 |
| Sandy loam | 20-45 | 15-53 | 28-40 |
| Loamy sand | 45-85 | 0-50 | 0-20 |
where any point has to satisfy the condition
ID:(2070, 0)