
Solutions Phase Diagram
Definition 
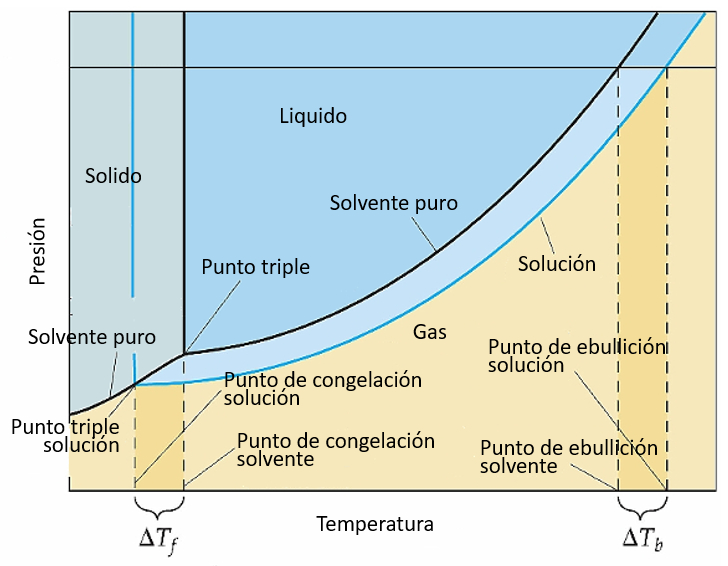
In a phase diagram of a solution, the boundaries between phases shift in such a way that, at the same pressure, the melting point decreases while the boiling point increases:
ID:(1980, 0)